雅思小作文分为A、G两类,A类为图表小作文,G类为书信小作文,本篇为各位考生介绍A类图表小作文的各种题型。A类小作文时间一般分配20分钟,字数要求不低于150字。本文将详细介绍各类图表类型作文模板:线图类、柱状图类、饼图类、流程图类、表格类、地图类、混合图类等。
A类图表小作文分类
1.线图类:
You should spend about 20 minutes on this task.
Eating sweet foods produces acid in the mouth, which can cause tooth decay. (High acid levels are measured by low pH values)
Describe the information below and discuss the implications for dental health.

2.柱状图类
You should spend about 20 minutes on this task.
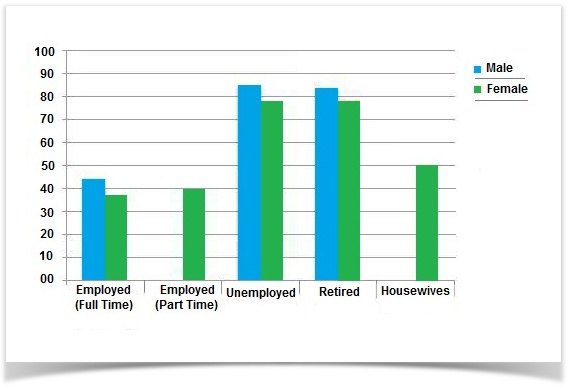
The chart below shows the amount of leisure time enjoyed by men and women of different employment status.
Write a report for a university lecturer describing the information below.
3.混合图类
You should spend about 20 minutes on this task.
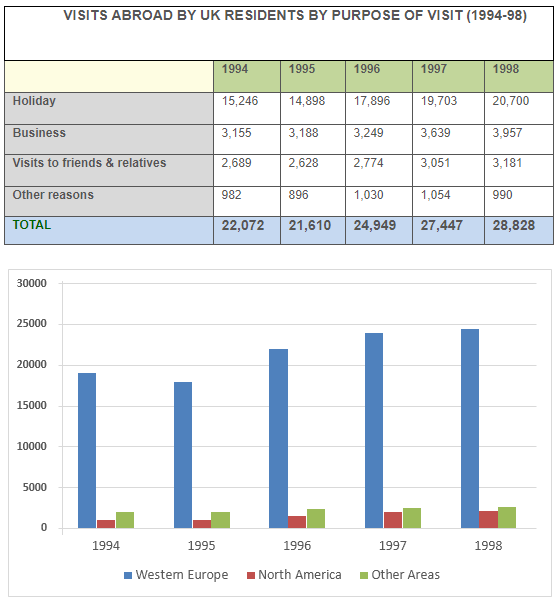
The first chart below shows the results of a survey which sampled a cross-section of 100,000 people asking if they traveled abroad and why they traveled for the period 1994-98. The second chart shows their destinations over the same period.
Write a report for a university lecturer describing the information shown below.
You should write not less than 150 words.
4.饼图类
You should spend about 20 minutes on this task.
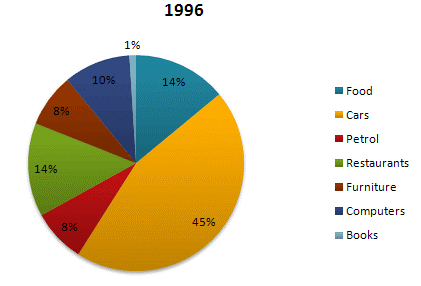
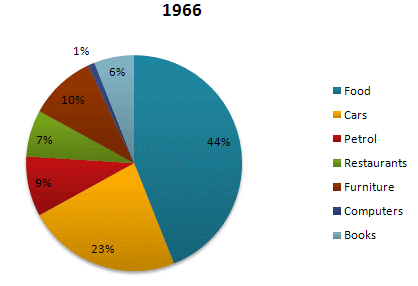
The given pie charts compare the expenses in 7 different categories in 1966 and 1996 by American Citizens.
Write a report for a university lecturer describing the information below.
5.流程图类
You should spend about 20 minutes on this task.
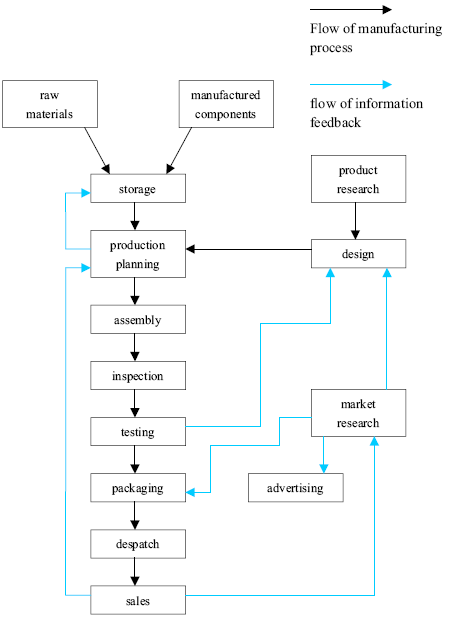
The diagram below shows the typical stages of consumer goods manufacturing, including the process by which information is fed back to earlier stages to enable adjustment.
Write a report for a university lecturer describing the process shown.
You should write at least 150 words.
6.表格类
You should spend about 20 minutes on this task.
The table shows the worldwide market share of the mobile phone market for manufactures in the years 2005 and 2006.
Summarise the information by selecting and reporting the main features, and make comparisons where relevant.
Write at least 150 words.
Worldwide Mobile phone Sales in 2005 & 2006 (% share of market)
| Company | 2005 % Market share | 2006 % Market share |
| Nokia | 32.5 | 35 |
| Motorola | 17.7 | 21.1 |
| Samsung | 12.7 | 11.8 |
| Sony Ericsson | 6.3 | 7.4 |
| L.G | 6.7 | 6.3 |
| BenQ Mobile | 4.9 | 2.4 |
| Others | 19.2 | 16.2 |
| TOTAL | 100.0 | 100.0 |
A类图表小作文模板
以如下话题为例:
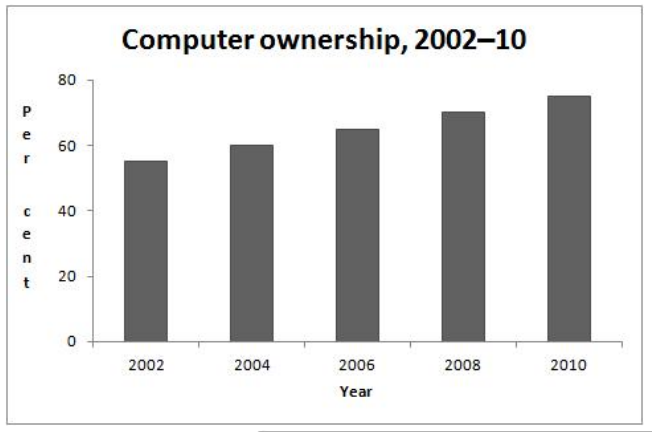
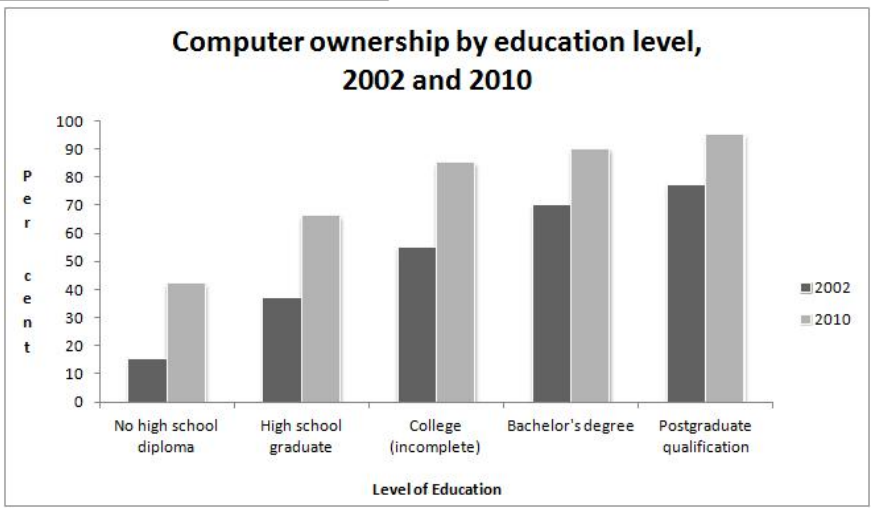
The graphs above give information about computer ownership as a percentage of the population between 2002 and 2010, and by level of education for the years 2002 and 2010.
Summarise the information by selecting and reporting the main features, and make comparisons where relevant.
Write at least 150 words.
这里有3-4个基础结构需要构建:
- 引出话题
- 摘要概述
- 阐述细节
- 给出结论(非必须)
1.引出话题
通常需要一两个句子作为开始,说明雅思写作这个图表所展示的内容,一般改写标题即可,但要注意时间等要素。
The charts show rates of computer ownership from 2002-2010, including a more detailed look at ownership patterns by level of education.
可以看出,只数问题的同意句型改写。
2.摘要概述
第二部分需要考生说明图表呈现的主要趋势是什么,对图表所包含的信息、要素做整体的概述,不需要强调细节,如从上图可以看出2002-2010电脑的拥有者数量是持续稳定增加的。
These data show a constant increase in the percentage of the population that owned computers during the eight year timeframe. This rising trend occurred across all education levels. However, although having more education correlated directly with higher computer ownership percentages from 2002-2010, the ownership percentage increased most among those with the least education during those years.
3.阐述细节
第二部分已经做了整体概述,第三部分需要做针对细节的描述。
In 2002, slightly more than half the population owned computers. That number increased to roughly 75% over the next eight years. Postgraduates were always ahead of the general population. While roughly three-quarters of postgraduates owned computers in 2002, that figure rose to nearly 95% by 2010. By contrast, those who had not finished high school began with only a 15% computer ownership rate, which increased to about 45% after eight years.
Notably, the three groups at the lowest end of the education spectrum saw the most significant computer ownership gains over this period. Their rate rose approximately 30 percentage points. College graduates and postgraduates saw more modest gains with 20 point increases between 2002 and 2010.
4.给出结论(非必须)
对于雅思A类图表小作文来讲,结论并不是必须的,考生可结合字数选择是否有必要补充一个结论,毕竟图表作文考的结论不是一个固有格式,而且一个结论对分数影响不大。本题可以补充如下结论:
The first decade of the 21st century saw steady gains in computer ownership among a variety of education levels.
