You should spend about 20 minutes on this task.
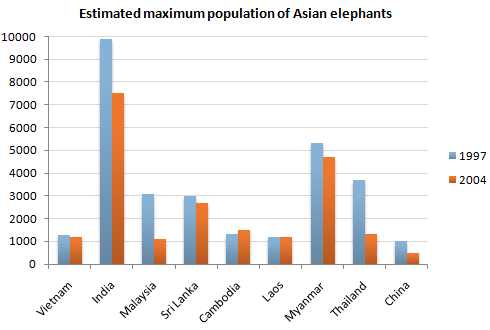
The graph below shows the changes in maximum number of Asian elephants between 1994 and 2007.
Summarise the information by selecting and reporting the main features, and make comparisons where relevant.
Write at least 150 words.

The graph shows the estimated maximum population of elephants in a range of Asian countries in both 1997 and 2004.
图表显示了1997年和2004年亚洲国家大象的最大数量。
In most of the countries included in the graph, the population fell. This was most noticeable in Malaysia and Thailand, where the number of elephants was thought to be less than half the figure in 1997. In the former, the number of elephants dropped as low as 1000. India remained the country with by far the largest elephant population, but experienced a dramatic fall in numbers so that in 2004 there may have been as few as 7500. Despite its size, China had a very small population of at most 500 elephants by 2004.
在图表中包含的大多数国家,人口都在下降。这一点在马来西亚和泰国最为明显。据信,马来西亚和泰国的大象数量不到1997年的一半。在前者,大象的数量下降到1000头。到目前为止,印度仍然是大象数量最多的国家,但大象数量急剧下降,2004年可能只有7500头。尽管中国幅员辽阔,但到2004年,中国的大象数量仍然非常少,最多只有500头。
Although the trend was downwards overall, elephant populations were thought to have remained stable in Laos and Vietnam at approximately 1200. The only country where elephants showed signs of recovering was Cambodia, where numbers may have risen by up to 200.
尽管大象数量总体呈下降趋势,但据信老挝和越南的大象数量保持稳定,大约在1200只左右。唯一出现大象恢复迹象的国家是柬埔寨,那里的大象数量可能增加到200头。
(155 words)
